Overview
Knowledge-based CLUster Evaluation (CLUE) is an approach to identify the mose informative partitioning of temporal phosphoproteomics data as described in this research article. The method has been implemented in R as the package ClueR this free web tool has been created to make using it straight-forward and intuitive. Example data is provided to showcase the features of the tool.
Data Input
Input data should be CSV format with elements separated by commas. The data should be a time course where the rows are phosphorylation sites with columns arranged chronologically. The correct organism needs to be selected in order for the correct phosphorylation site database to be loaded and used. The example data set can be downloaded here.
Clustering
Once your data is selected, choose the range of cluster centers to test over from 2 up to 35 centers, as well as the number of repetitions. The effective size is the range of sizes for which annotation groups will be considered for calculating enrichment such that groups that are too small or large will not be used for calculating the overall enrichment of the clustering.
Membership and Enrichment Tables
These tables detail the probabilities of a substrate belonging to a cluster and those kinases whose substrates are enriched within a cluster. The membership table is initially ordered alphabetically but can be reorded by columns (clusters) and specific substrates can be searched for within the table.
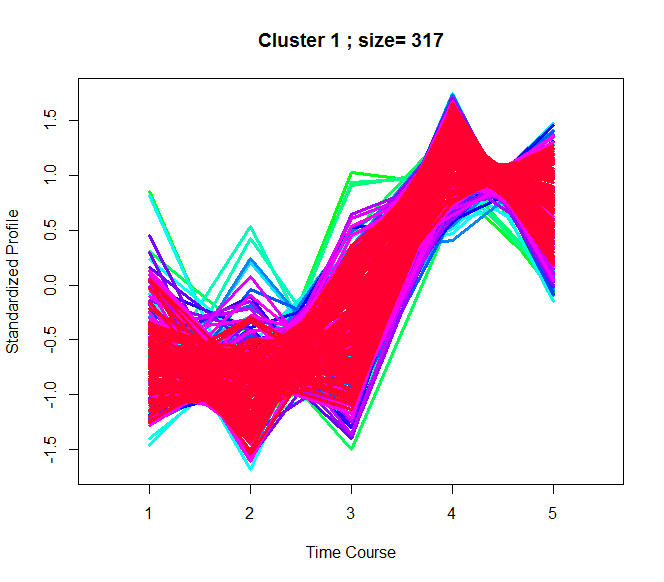
Fuzzy Plot
The fuzzy plot is a visual representation of the temporal profiles of phosphorylation sites within each cluster. Membership scores of all sites within a cluster are used to create a colour gradient from green to red that corresponds to lower to higher clustering confidence.
Acknowledgements:
ClueR developed by Pengyi Yang
Shiny app developed by Matthew Rushworth