Quantitative Performance Evaluator for Proteomics
 User Guide
Evaluation Matrix
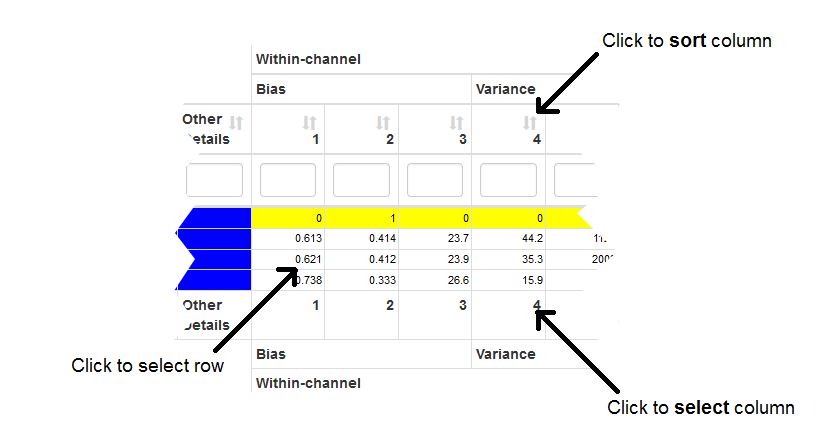
An interactive table that stores the raw data processing details and calculated metrics is the main feature of this tab. Each row corresponds to a particular data analysis uploaded by a user and a column contains values for a particular metric. Metric comparison can be restricted to any subset of the table by selecting rows and columns. Row selection is performed by clicking on any cell in the table. Column selection occurs when a column name is clicked at the bottom of the table. Clicking on a column name at the top of the table will sort the rows of the table by the values of that column.
The displayed data is summarised as an overall mean value or the metric's average standard devation per group (run or channel), depending on the choice selected under Metric Summary. The standard deviation is represented as N/A for those metrics which only have one measurement per group.
There are three ways in which the data processing results may be compared:
- Select Best
- Clicking the Select Best button causes the calcuation of the best method set based on the most number of categories closest to the Ideal method set and also based on the sum of absolute distances of all the selected metric colums. Apart from displaying the best method set(s), a row of information is also provded explaining which metrics was the method set closest to the Ideal set to and the absolute distance sum to the best metric by the minimum of the absolute distances sum method.
- Plot PCA
- Based on the selected metrics and the selected method sets, a 2-dimensional principal components analysis plot is generated. This can be useful to infer which method sets are most alike and which are rather different.
- Plot Comparison
- A comparison plot is a graph that allows flexible comparisons of method sets and performance metrics. Metrics are typically grouped by either run or channel and plotted as a boxplot. If a metric only has one measurement per grouping factor level, it is plotted as a bar instead. Different levels of an analysis factor may be expanded as rows or columns of the plot, by choosing the factor from the Rows By or Columns By choice lists, or as different colour boxes or bars, using the Colour By choice list. If more than one column of performance metrics is selectMethod the Selected Metrics option must be chosen in either the Rows By or Columns By choice lists. The red line in each graph shows the ideal metric value for that metric.
New Processing Upload
This tab provides a simple graphical interface to upload a new data processing result. The format of the text file required is described in detail at the bottom of this tab. Once the Submit New Analysis button is clicked, all of the metrics are calculated and the underlying results are saved to disk.
| Within-channel | Linear regression between expected and observed fold changes on the log 2 scale of protein amount to the median protein amount of the lowest amount proteins, in each channel. |
| Intercept | Intercept of the regression line. |
| Slope | Slope of the regression line. |
| Line Difference Sum | Sum of absolute vertical differences between the regression line and the identity line, calculated at the seven expected fold changes. |
| Residual Sum | Sum of the absolute differences between the observed fold changes and the regression line. |
| Within-run | Each protein's amount is divided by its amount in iTRAQ channel 121. All proteins are present at the same amount in channel 121 in every run, so it is used as the reference channel. The resulting log 2 -transformed fold changes are used in a linear regression of expected fold change with observed fold change. |
| Intercept | Intercept of the regression line. |
| Slope | Slope of the regression line. |
| Line Difference Sum | Sum of absolute vertical differences between the regression line and the identity line, calculated at the seven expected fold changes. |
| Residual Sum | Sum of the absolute differences between the observed fold changes and the regression line. |
| C.V. Channel Sums | Amounts of all proteins within a channel are summed. The coefficient of variation is calculated using all of the sums of the iTRAQ channels other than 121, which has a different total amount. |
| C.V. Design Group Sums | Amounts of all proteins within a protein group, as defined by the experimental design, are summed across all iTRAQ channels. The coefficient of variation is calculated using all of the sums of the protein groups. |
| C.V. Size Group Sums | Amounts of all proteins within a size group are summed across all iTRAQ channels. The coefficient of variation is calculated using all of the sums of the proteins of the size categories. |
| Between-runs | Metrics to quantify the variability between the seven mass spectrometry runs. |
| C.V. Median Proteins | The median protein amount for each run is found. The coefficient of variation of the median protein amounts is calculated. |
| C.V. Channel Sums | Amounts of all proteins within a channel are summed across all runs. The coefficient of variation is calculated using the all of the sums of the iTRAQ channels other than 121, which has a different total amount. |
| C.V. Design Group Sums | Amounts of all proteins within a protein group, as defined by the experimental design, are summed across all runs. The coefficient of variation is calculated using all of the sums of the protein groups. |
| C.V. Size Group Sums | Amounts of all proteins within a size category are summed across all runs. The coefficient of variation is calculated using all of the sums of the size categories. |
Provide the processing parameters and upload a text file of protein quantities for evaluation.