Melanoma Explorer

This application portal enables the visualisation and analysis of a wide range of preprocessed omics datasets. A Feature is the basic unit of measurement and could correspond to clinical variables, genes, transcripts, proteins, or any feature measured on a sample. A range of tools is provided to explore patterns in the features across samples.
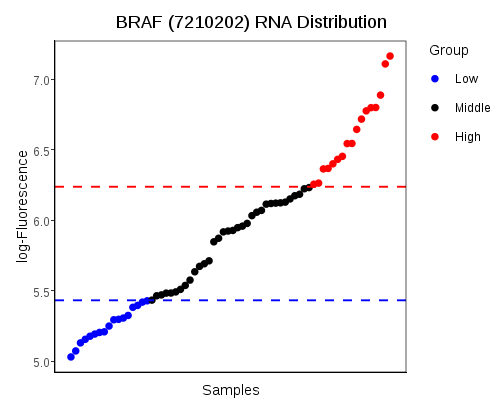
- Measurement Viewer allows for the visualisation of the distribution of measurement values. The plot also allows the samples to interactively be divided into two classes, for the Survival Plot tool.
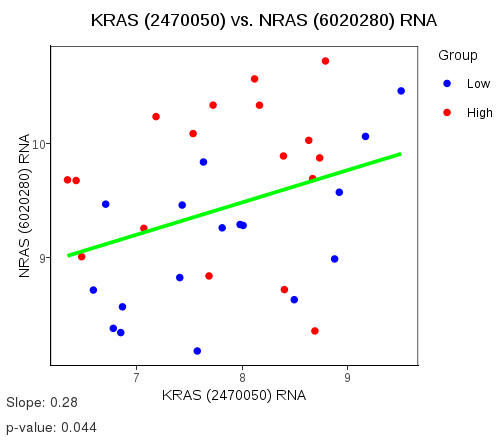
- Measurement Definer enables the comparisons of a particular feature measured by two or more different assays or the comparison of two different measurements of the same sample. Examples of its usage are comparing the same gene’s mRNA and protein measurements, or the same sample measured on the same microarray platform at different times (technical replicates). If there are two sets of measurements to compare, the plot is a scatterplot. For three or more sets of measurements, a parallel plot is made.
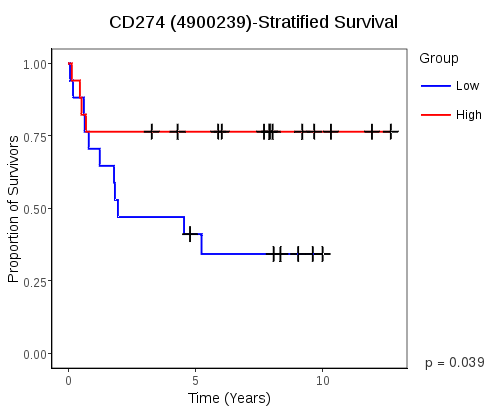
- Survivial Plots computes a log-rank test p-value and displays a surivival plot based on the groupings chosen with the Measurement Viewer tool. A p-value contour plot is also available, showing a heatmap of the p-values for all choices of grouping thresholds.
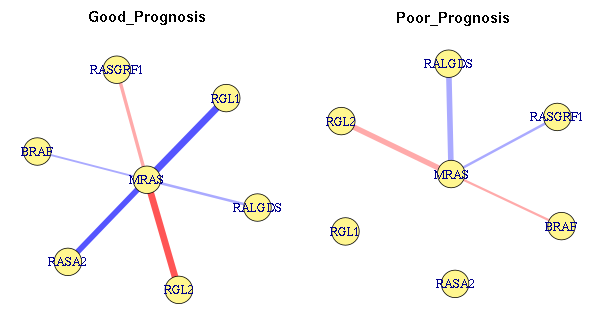
- Network Variability Analysis enables the discovery of dysregulated networks between two conditions using statistical tables and network visualisation, based on predefined hubs and interactors.
- Classification allows cross-validated classification to be done by either DLDA or SVM after the samples are partitioned into two groups. Balanced error rates and sample-wise error rates are calculated.
Each tool has its own detailed documentation. For more details about the options available, navigate to the particular tool and click on the Instructions tab.
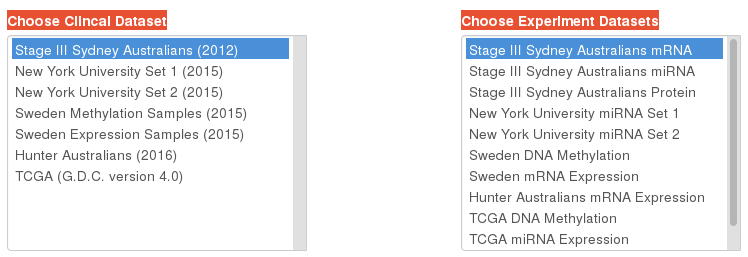

The following clinical datasets are available:
| Dataset Name | Details | |
|---|---|---|
| Stage III Sydney Australians (2012) | Metastatic melanoma. Survivial time since lymph node metastasis found in clinic. 84 samples. Data freeze: August 2012 | Download Table ... |
| New York University Set 1 (2015) | Congenital nevi and primary melanoma. Abbreviations used: RLN = regional lymph node. DV = distant visceral. RS = regional skin. DS = distant skin. 101 samples. Data freeze: February 2015 | Download Table ... |
| New York University Set 2 (2015) | Primary melanoma. Abbreviations used: RLN = regional lymph node. DV = distant visceral. RS = regional skin. DS = distant skin. 119 samples. Data freeze: May 2015 | Download Table ... |
| Sweden Methylation Samples (2015) | Metastatic melanoma. 50 samples. Data freeze: May 2015 | Download Table ... |
| Sweden Expression Samples (2015) | Contains primary tumours, metastases, and recurrences. 214 samples. Data freeze: April 2015 | Download Table ... |
| Hunter Australians (2016) | Contains a range of primary and metastatic tumours which were FFPE preserved. 141 samples. | Download Table ... |
| TCGA (G.D.C. version 4.0) | Contains a range of primary and metastatic tumours. Source: G.D.C. version 4.0 | Download Table ... |
The following omics experimental datasets are available:
| Dataset Name | Repository ID | Details | |
|---|---|---|---|
| Stage III Sydney Australians mRNA | GSE54467 | Illumina gene microarray. Different normalisation method used (NEQC) to journal publication in International Journal of Cancer . 79 samples. | Download Table ... |
| Stage III Sydney Australians miRNA | GSE59334 | Agilent microarray. Analysis published in Pigment Cell & Melanoma Research, 2015 . 45 samples. | Download Table ... |
| Stage III Sydney Australians Protein | Not Released | Untargeted mass spectrometry. Analysis published in Pigment Cell & Melanoma Research, 2014 . 33 samples. | Download Table ... |
| New York University miRNA Set 1 | GSE62370 | Two-colour microarray. log-ratio to pooled sample. Analysis published in Journal of the National Cancer Institute, 2015 . 101 samples. | Download Table ... |
| New York University miRNA Set 2 | GSE62371 | Two-colour microarray, different design to Set 1. log-ratio to pooled sample. Analysis published in Journal of the National Cancer Institute, 2015 . 119 samples. | Download Table ... |
| Sweden DNA Methylation | GSE51547 | Illumina HumanMethylation450 microarray. Analysis published in BMC Medical Genomics, 2015 . 50 samples. | Download Table ... |
| Sweden mRNA Expression | GSE65904 | Illumina HumanHT-12 version 4 microarray. Analysis published in Oncotarget, 2015 . 214 samples. | Download Table ... |
| Hunter Australians mRNA Expression | GSE59455 | Illumina HumanRef-8 WG-DASL v3.0 microarray. Analysis published in Oncotarget, 2016 . 141 samples. | Download Table ... |
| TCGA DNA Methylation | Genomic Data Commons | Beta values. Analysis published in Cell, 2015 . 470 samples. | Download Table ... |
| TCGA miRNA Expression | Genomic Data Commons | RPM. Analysis published in Cell, 2015 . 447 samples. | Download Table ... |
| TCGA mRNA Expression | Genomic Data Commons | FPKM. Analysis published in Cell, 2015 . 468 samples. | Download Table ... |
The following preprocessed analyses are available:
| Dataset Name | Details | |
|---|---|---|
| VAN Australian Survival Groups (Pearson Correlation) | Pearson correlation is used as a statistic to examine differences in correlation between hubs and interactors of the MetaCore protein interaction database. | Download Archive (ZIP) ... |
The distribution of numeric measurements is plotted with samples on the x-axis and measured values on the y-axis. The samples are sorted by increasing measurement value, from left to right. The samples may be divived into two extreme groups by changing the slider positions, if Group Samples Using is set to Measurement Viewer on the Dataset Definer Tab. Dragging the points on the slider changes the lower and upper thresholds. Samples with values below the lower threshold are taken to be in one group, whereas samples above the upper threshold form the second group. Alternatively, they may be coloured according to the two groups defined by the Dataset Definer's rule builder. The title and axes of the plot can be customised with the special value $FEATURE, which refrences the feature of interest.
The Transform log 2 option must not be applied if the input data is already in log 2 scale.
This plot allows the comparison of features shared between samples as either a scatterplot for a pair of features or parallel plot, for three or more features. Features may be added from any dataset, as long as the feature has measurements for the same samples as those which any existing features in the comparison list are from. A linear regression finds the slope of the regression line (ideally 1) and the p-value of some relationship existing. Two types of regression are available; Ordinary, which uses squared penalties for fitting the line and Quantile, which uses linear penalties. The plot's axes labels and title may be customised using the special values $FEATUREX and $FEATUREY.
Survival of patients in two groups over time is visualized with a Kaplan-Meier plot and the significance of survival profile differences is computed using the log-rank test. The groupings are based on the thresholds chosen with either the Measurement Viewer tool or the rule builder on the Dataset Definer tab.
The contour plot is relevant to groupings made using the Measurement Viewer and provides a visualisation of how stable the difference is to changes in the numeric thresholds used by the grouping definition. All possible combination of integer-valued upper and lower thresholds are explored and the p-values presented as a heatmap. If the chosen thresholds are stable, then a large region of the heatmap surrounding their square’s location will have similar colours to their square. Each of the p-value calculations are independent, and are run in parallel on the server to generate the plot quickly. A table below the plot gives the lower and upper thresholds for all combinations of values that result in the minimum calculated p-value.
The Table Explorer tool allows the sorting and searching of network differential variability analysis output files from VAN. Clicking on a column name sorts that column in ascending or descending order. Clicking the column name again sorts it in descending order, if it is in ascending order, and vice versa.
The Network Plots tab contains three plots of defined networks. Two of the network plots show the strength of assications between the hub node and the interactors in two experimental conditions. For Pearson and Spearman correlations, the edges are coloured using blue-white-red colour scheme, with blue representing a negative value and red representing a positive value. The third plot illustrates the absolute difference in associations between the two conditions. The darkness of the line is proportional to the magnitude of the change.
The Hub Degree Plot allows trends to be identified between the degree of the hub node and the p-values, which could suggest additional normalisation is warranted for the results presented in the Network Dysregulation tab of the Table Explorer tab.
For any two groups defined by the rule builder on the Dataset Definer tab within the Datasets and Grouping tab, cross-validated classification can be performed.
The Settings tab allows the cross-validation scheme, feature selection method, and classifier to be chosen. The seed option allows the setting of a number which results in reproducible partitioning of the samples into a training and test set. Leave the field blank to use no seed. Feature selection uses an algorithm to rank the features, and tests the top-ranked features to determine which set has the best resubstitution error. ADM is an abbreviation for Absolute Differences of group Medians. For the SVM classifier, the default cost parameter of 1 is used.
Once the Run button is clicked, the results will become available in the Cross-validation Error and Sample-wise Error some time later.
The Cross-validation Error tab shows the distribution of errors across all cross-validations as a boxplot if resampling and folding was chosen, otherwise it shows the balanced error rate as text.
The Sample-wise Error tab shows the classification error of each sample considering all cross-validations as a heatmap. If the cross-validation method is k-fold, then the error will be either 0 or 1.
Consider between